CorrectSPC - SPC for Precision Machining - Stop the X-bar R Madness! - YouTube
If all your runs are small won't the "special causes" (across many runs) form a normal distribution allowing you to predict your process capabilities?
1) The point of SPC is to seek out special causes and react to them. here, you would be looking for special causes within special causes.
2) A normal distribution of data from a known special cause has no particular value. Shewhart charts do not rely on a normal distribution, but they
do rely on independent, random variation. That is not what tool wear is, and that is why X-bar R charts are
statistically incorrect for precision machining.
3) Standard Shewhart SPC charts (x-bar/R, I-MR) have no relation to capability.
Even if your distribution is flat and hard limited (parts outside are thrown away) your averages (X-Bar) will still show normal won't they?
1) Again, you already know you have the special cause of warm-up and set-up. Even if the distribution is “normal”, any further special cause will be masked by warm-up and start-up.
2) For precision machining, a normal distribution is a sign that the process is
not in control! It shows either overcontrol , excessive gage or measurement error (two different things) or instability. The charting should show a steady trend from tool wear, with adjustment, generating a sawtooth curve, which is the continuous uniform distribution.
In precision machining, normal is bad.
Yes, I agree, it takes a lot more thinking on how to handle the data in a small run shop and this falls outside of most basic SPC training.
Absolutely. I recommend using X hi/lo R charting – even for short runs –as it will tell you when to adjust and will assure you that no bad parts will be made (unless the tool breaks - special cause - then it will tell you bad parts have been made.) The key is that you do not use averages – which hide your within-part variation, as well masking important clues to your product quality. For precision machining, X-bar /R is worthless – and that
does fall outside of basic SPC training (and most trainer’s expertise).
The biggest point I always make is you should never, never, ever do this for your customer.
Some customers want assurance that you have a clue what you made. It is
“report card charting”. It is not as powerful as process variable charting,
but it does have a point. However, if it is using the wrong chart, it will confuse both the customer and the operators, and that is dangerous and wasteful.
If it does not help you it is a waste of time and money and is not working.
I agree!!!
That is why you should not use X-bar R in precision machining! Use something that actually plots the GD&T of the feature!
Don't learn the lingo, learn how to make work for you.
Don't learn the lingo, learn how to use it correctly! If it doesn't work for you, you are not using correctly. If you have to make up "special rules" - especially for control limits - it is a sign it is either not working or the wrong tool. You can not "make it" work for you. But, the right tool, implemented correctly, will work for you.
If it doesn't put more money in the checkbook it is a useless tool.
I agree!
That is why X hi/lo-R charting is so valuable. It gives you correct insight when to adjust your procss, can tell you your tool wear rate per part (and, therefore the effectiveness of your tool), can show you the effects over time of the tool pressures between roughing and finishing tools, can even tell you when to change your tools before they break, in some cases!
X-bar R charting can not do that!! So, use that tool that can put money in your pocket - and takes no more (if not less) effort than those old X-bar R charts!
In a nutshell:
• The X bar chart from the X bar – R charts represent the
average of a statistically insignificant sample of measurements for a of a circular or linear feature
• R charts from the X bar – R charts represent the
range of measurement error
Neither of those charts, therefore, provides any data that accurately represent your process!
• Control limits are calculated using statistics for the
wrong distribution – the normal distribution. The correct distribution for precision machining is the
continuous uniform distribution.
•
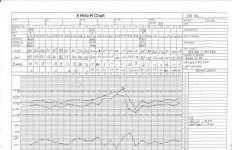
X hi/lo – R charts represent the GD&T characteristics of a circular feature: diameter and the zone represented by roundness (or length and parallelism for a linear dimension)
• X hi/lo – R charts provide more valuable data, such as tool wear rate
• X hi/lo – R charts use the correct uniform distribution for precision machining - the continuous uniform distribution
• X hi/lo – R charting techniques can be expanded to control taper
Remember this:
• Automated tool wear compensation is
not statistical process control. It is codified overcontrol.
•
The algorithm for compensation becomes the process, not tool wear
• Lose some benefits of SPC because the constant adjustment masks the information
• Would help if the compensation was tracked
If you are interested in free, quick video training on the correct methodology for SPC for precision machining,
click here


")